


Asaf and I founded Logz.io in 2015 to provide developers with the ultimate open source log management experience. With our product, logging with the ELK Stack was simple, efficient, and automated for the first time – so customers could save engineering costs and accelerate MTTR.Why Only Looking at Logs Isn’t EnoughWhile Logz.io improved visibility into complex systems, we … [Read more...] about The Future of Logz.io: Simple, Cost-effective Observability
Observability
Streamlining Observability: The Journey Towards Query Language Standardization
One of the most captivating discussions I had at KubeCon Europe 2023 in Amsterdam was about standardization of a query language for observability. This query language standard aims to provide a unified way of querying observability data across logs, metrics, traces, and other relevant signals. The conversation shed light on the pressing need for a standardized approach to … [Read more...] about Streamlining Observability: The Journey Towards Query Language Standardization
Using the Elastic Agent to monitor Amazon ECS and AWS Fargate with Elastic Observability

Serverless and AWS ECS FargateAWS Fargate is a serverless pay-as-you-go engine used for Amazon Elastic Container Service (ECS) to run Docker containers without having to manage servers or clusters. The goal of Fargate is to containerize your application and specify the OS, CPU and memory, networking, and IAM policies needed for launch. Additionally, AWS Fargate can be used with … [Read more...] about Using the Elastic Agent to monitor Amazon ECS and AWS Fargate with Elastic Observability
Unleash the power of Amazon Kinesis Data Firehose and Elastic for enhanced observability
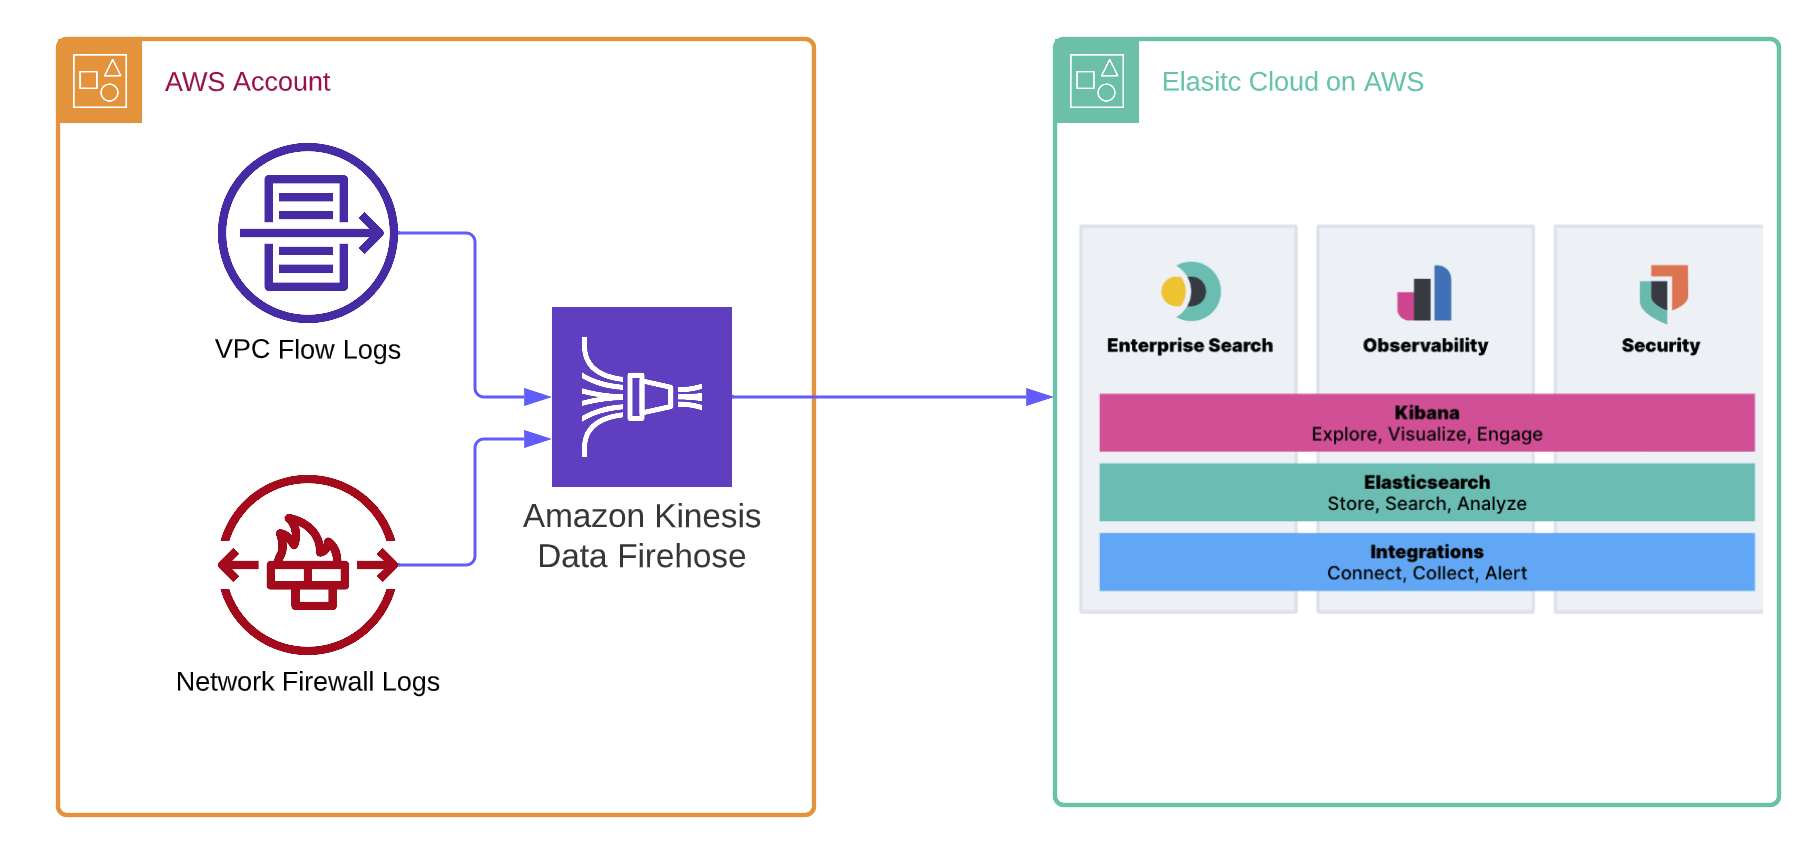
As more organizations leverage the Amazon Web Services (AWS) cloud platform and services to drive operational efficiency and bring products to market, managing logs becomes a critical component of maintaining visibility and safeguarding multi-account AWS environments. Traditionally, logs are stored in Amazon Simple Storage Service (Amazon S3) and then shipped to an external … [Read more...] about Unleash the power of Amazon Kinesis Data Firehose and Elastic for enhanced observability
Why Logz.io for Observability | Logz.io
Datadog, New Relic, and Splunk have pioneered observability from the 2010s through the early 2020s.Their premium status, and associated costs, are rationalized by their huge feature sets and product suite. In the last 15 years, well-funded startups to blue chip companies could justify paying a premium price for observability. After all, observability was, and remains, a … [Read more...] about Why Logz.io for Observability | Logz.io
Gain insights into Kubernetes errors with Elastic Observability logs and OpenAI
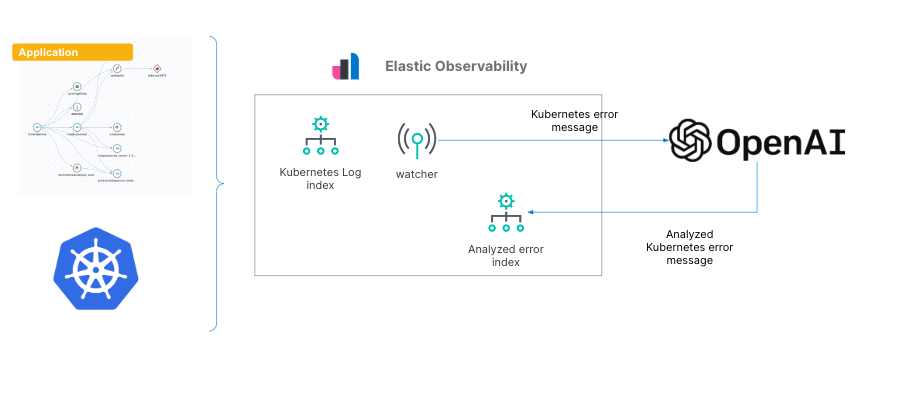
As we’ve shown in previous blogs, Elastic® provides a way to ingest and manage telemetry from the Kubernetes cluster and the application running on it. Elastic provides out-of-the-box dashboards to help with tracking metrics, log management and analytics, APM functionality (which also supports native OpenTelemetry), and the ability to analyze everything with AIOps features and … [Read more...] about Gain insights into Kubernetes errors with Elastic Observability logs and OpenAI
3 Observability Takeaways from DevOps Pulse 2023
The observability landscape is changing fast, as organizations look to deploy applications and separate themselves from competition at a breakneck pace.What are the trends organizations need to be aware of as they make sense of the landscape? Every year, we at Logz.io set out to answer this question by going right to the DevOps and observability practitioners on the front … [Read more...] about 3 Observability Takeaways from DevOps Pulse 2023
Overcoming Kubernetes Monitoring Challenges with Observability
At Logz.io, we’re seeing a very fast pace of adoption for Kubernetes–at this point, it’s even outpacing cloud adoption, with companies running on-prem fully adopting Kubernetes in production.Why are companies going in this direction? Kubernetes provides additional layers of abstraction, which helps create business agility and flexibility for deploying critical applications. At … [Read more...] about Overcoming Kubernetes Monitoring Challenges with Observability
How to use Elasticsearch and Time Series Data Streams for observability metrics

With integrations, we give our users an out of the box experience to integrate with their infrastructure and services. If you are using our integrations, eventually you will automatically get all the benefits of TSDS for your metrics assuming you are on version 8.7 or newer.Currently we are working through the list of our integration packages, add the dimensions, metric type … [Read more...] about How to use Elasticsearch and Time Series Data Streams for observability metrics
Monitoring service performance: An overview of SLA calculation for Elastic Observability
17. Click next and create and start. This can take a bit, so don’t worry.To summarize, we have now created a pivot transform using a bucket script aggregation to calculate the running time of a service in percentage. There is a caveat because Elastic Agent, per default, only collects the every 60 seconds the services state. It can be that a service is up exactly when collected … [Read more...] about Monitoring service performance: An overview of SLA calculation for Elastic Observability