Now that we have the offset, how do we use that to actually read the data that the library puts there for us? This brings us back to the magic fs: portion of the mov instruction that we discussed earlier. In X86, most memory operands can optionally be supplied with a segment register that influences the address translation.Segments are an archaic construct from the early days … [Read more...] about Beyond the trace: Pinpointing performance culprits with continuous profiling and distributed tracing correlation
performance
Using Elastic Agent Performance Presets in 8.12
5. CustomWhile presets are designed to simplify the tuning process for Elastic Agent, the Custom option allows the user to have more granular control over performance. You can still refer to the old guidance provided by Elastic, which is still relevant on Agent as the queue.mem.events are now also configurable. The old guidance, available here, offers practical examples and … [Read more...] about Using Elastic Agent Performance Presets in 8.12
How Elastic AI Assistant for Security and Amazon Bedrock can empower security analysts for enhanced performance
Elastic Cloud enables users to search, solve, and succeed with one platform, three search-powered solutions, built on a single technology stack. It is designed for any type of data — deployable anywhere — to solve your search, observability, and security challenges. Elastic® users benefit from a unified data analytics platform, which dramatically reduces the cost and complexity … [Read more...] about How Elastic AI Assistant for Security and Amazon Bedrock can empower security analysts for enhanced performance
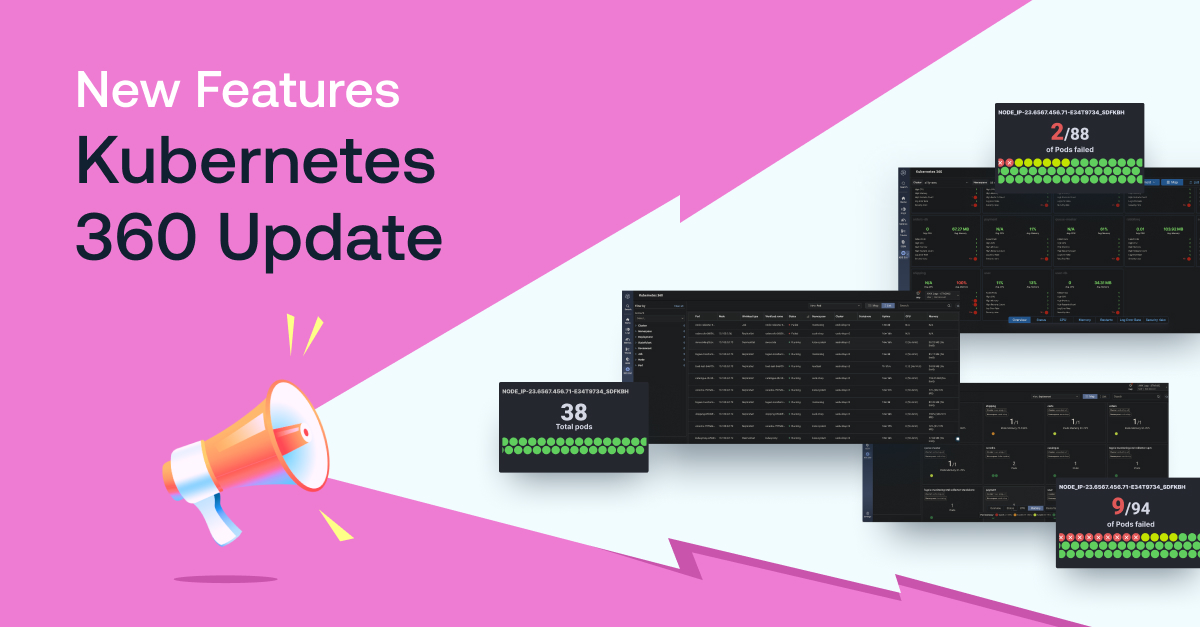
Announcing Kubernetes 360 Updates for Deeper Visibility into Kubernetes Performance
We’re thrilled to announce new feature updates for Logz.io’s Kubernetes 360 to provide deeper visibility and additional troubleshooting capabilities for your Kubernetes environment. For Kubernetes 360, we’ve added the ability to select a specific deployment with filters and see it across all clusters, a Metrics tab in every resources quickview so you can see behavior over time, … [Read more...] about Announcing Kubernetes 360 Updates for Deeper Visibility into Kubernetes Performance
2023 Gartner Magic Quadrant for Application Performance Monitoring and Observability
Consistent performance and continuous improvement: these are the fundamentals we should aspire to in the world of cloud software delivery. We focus on ensuring our systems become more consumable, enjoyable and innovative. We seek to make customers’ lives easier and more productive through incremental achievements, and doing a better job, every day.This commitment to positive … [Read more...] about 2023 Gartner Magic Quadrant for Application Performance Monitoring and Observability
Improving the Elastic APM UI performance with continuous rollups and service metrics
Our journey began back in the 7.x series where we noticed that doing ad-hoc aggregations on raw transaction data put Elasticsearch® under a lot of pressure in large-scale environments. Since then, we’ve begun to pre-aggregate the transactions into transaction metrics during ingestion. This has helped to keep the performance of the UI relatively stable. Regardless of how busy … [Read more...] about Improving the Elastic APM UI performance with continuous rollups and service metrics
Monitoring service performance: An overview of SLA calculation for Elastic Observability
17. Click next and create and start. This can take a bit, so don’t worry.To summarize, we have now created a pivot transform using a bucket script aggregation to calculate the running time of a service in percentage. There is a caveat because Elastic Agent, per default, only collects the every 60 seconds the services state. It can be that a service is up exactly when collected … [Read more...] about Monitoring service performance: An overview of SLA calculation for Elastic Observability
Perf8: Performance metrics for Python
We're building this neat service in Python to ingest data in Elasticsearch from various sources (MySQL, Network Drive, AWS, etc.) for Enterprise Search.Sucking data from a third-party service to Elasticsearch is usually an I/O-bound activity. Your code sits on opened sockets and passes data from one end to the other. That's a great use case for an asynchronous application in … [Read more...] about Perf8: Performance metrics for Python
Cracking Performance Issues in Microservices with Distributed Tracing
Microservices architecture is the new norm for building products these days. An application made up of hundreds of independent services enables teams to work independently and accelerate development. However, such highly distributed applications are also harder to monitor.When hundreds of services are traversed to satisfy a single request, it becomes difficult to investigate … [Read more...] about Cracking Performance Issues in Microservices with Distributed Tracing
Product Spotlight: Logz.io Service Performance Monitoring
We believe that one of the most powerful capabilities added to the Logz.io Observability Platform in recent months is our new Service Performance Monitoring (SPM) feature set. As you may have seen earlier this year, Logz.io was named a Visionary in the 2022 Gartner® Magic Quadrant(™) for Application Performance Monitoring and Observability. To that end, SPM is a cornerstone for … [Read more...] about Product Spotlight: Logz.io Service Performance Monitoring


